Noirmont - Creating an Intermediate Map for the Gembloux Gap
Within the TooFatLardies publication At the Sharp End, their Chain of Command campaign supplement, are rules for counterattacking a faltering force that has lost the initiative. In our recent Taking the Gembloux Gap campaign, my Germans were the epitome of a "faltering force." They simply could not circumnavigate the French position in the vicinity of Villeroux, try as they might. After about three hours of repeated attempts, the German strength was spent and the French had amassed their armor to form a localized counter-attack into the German spearhead.
The campaign supplement allows for such counterattacks to take place, with the forces struggling over the preceding map on the campaign ladder. It seems to me that if a previously attacking force is now defending territory that they've fought over and won, they should take up positions around their previous objective. That requires, then, an extension of the map/table instead of purely replicating the table having the fight go the opposite direction.
Naturally, this requires a bit of research in order to determine the appropriate terrain on the previously "off table" portion of the table. This post examines the method I used to work out the terrain.
Having failed to take Villeroux (Table 3), the French would counterattack back towards Noirmont (Table 2). Instead of replicating Table 2 in its entirety, we decided to use the existing western half of the table, but slew it over to become the eastern half. We then looked further west and extended the table to the west of the previously fought-over culverts.
In order to replicate this piece of terrain, I consulted four main sources: Google Earth, a 1:5,000 map of Belgium produced by Phillipe Christian Popp in the mid 19th-century, and two War Office produced maps: G.S.G.S. 4040 1:50,000 from 1938-39 and G.S.G.S. 4336 1:100,000, which was a series based on First World War maps revised with aerial photos.
The two War Office maps provided an initial picture of the area surrounding Noirmont, specifically the region that Table 2, Turn 3 of the campaign took place and the region immediately to the west. Through these maps, it seemed clear that other than a church/chapel to the west, there weren't too many structures west of Noirmont.
 |
| G.S.G.S. 4336 - 1:100,000 showing the region surrounding Noirmont |
 |
| G.S.G.S. 4040 - 1:50,000 with the same area as above, but more detail |
Next up, I took a look at Popp's 19th-century chart of the region. Being at 1:5,000 it showed incredible detail of the land plots, riverways, and buildings; that said, at least five or six decades (if not more) of buildup occurred between Popp's publishing of this chart and when the battles around Gembloux took place in 1940. Despite this, both his chart and those from the late 1930s show very little in the way of built up structures to the as you travel west away from the two T-junctions present in Table 2 of the campaign.
 |
| Phillipe Christian Popp's mid 19th-century 1:5,000 chart (oriented with east-northeast-up) |
 |
| Popp's chart oriented north-up including a box enclosing the proposed table area |
After consulting the small- and large-scale charts from the decades or years immediately prior, I then consulted Google Earth to examine the geographic features. The river running north/south is readily apparent, showing light vegetation along the streambed. Vegetation and waterways can change significantly over the course of 80 years, so I took the tree-growth with a slight grain of salt. The river/stream shown from these satellite images more or less matches the stream from the aforementioned charts, so no need to alter that.
These images also show quite a lot of buildup over the last 60-80 years, but we've determined with decent accuracy from the contemporary charts that most of this wasn't present at the time of the battle. It still provided a look at the structures that were there, the culvert area, etc.
 |
| Google Earth satellite images from summer 2009 |
 |
| Google Earth satellite images from winter 2021 |
 |
| Culvert/stream looking south |
 |
| Culvert/stream looking north |
Based on these resources, as well as the map published from the campaign, I was able to generate a plausible map to represent the region just west of the culverts. The previous map (Table 2) had the stream mark its westernmost border. For our map (Table 2.5), this stream marked the approximate centerline of the map, with the paved road now on the far east side of Table 2.5. Essentially, half of the map remained the same, just slewed over from the west half to now the east half.
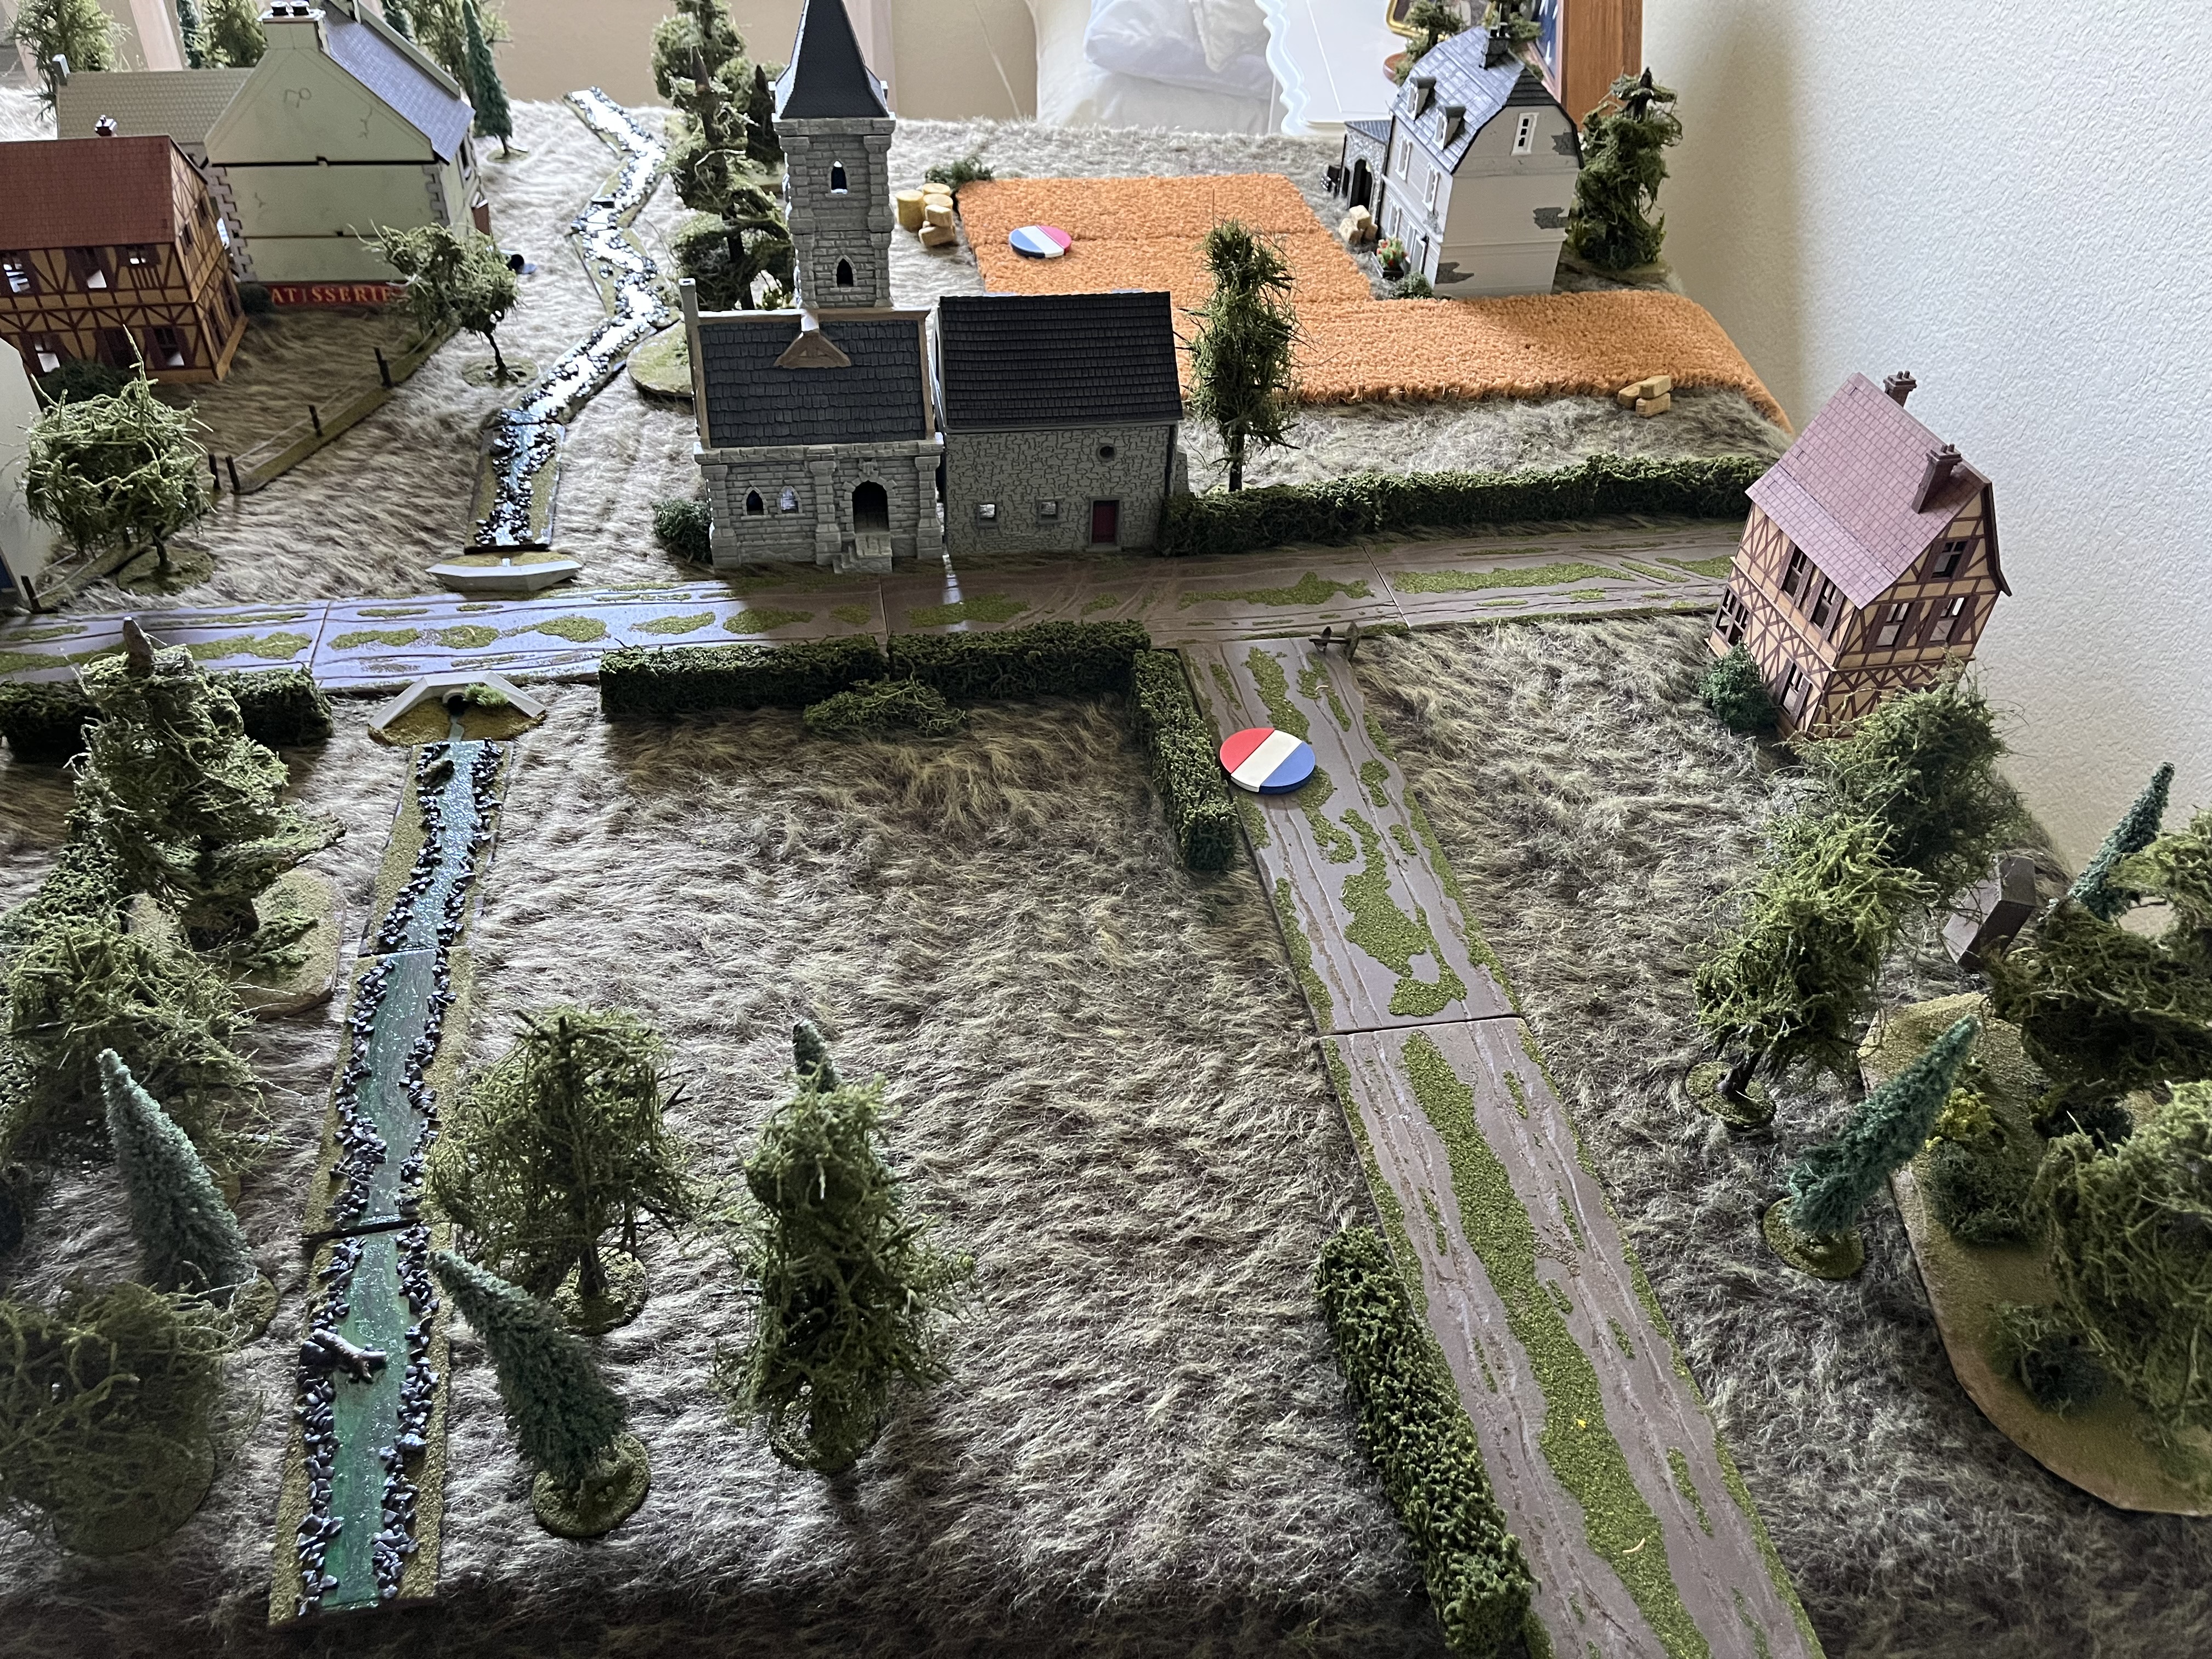
The dirt road heading west out of town was extended, as well as adding a small dirt track that ran north off of the east/west road as shown in Popp's map. I lined the road with hedges to match the approximate hedgerow density seen in the campaign map - likewise with wooded areas. The church was added along with a small outbuilding along the road. Lastly, since the ground appeared quite open, we added an additional wheat field and a farmhouse to fill in some of the area.
Below is the final result - both the planned layout and the actual table itself!
 |
| Taking the Gembloux Gap Table 2 |
 |
| "Table 2.5" |
 |
| The table itself, looking westward |
 |
| The eastern half of the table (looking south) |
 |
| The western half of the table (looking south) |
The research resulted in a plausible "third half" of Table 2, and was a truly enjoyable research project. I enjoy pouring over old maps and wondering what the ground truly looked like, so this was a blast to research and produce. Hope you all enjoyed the process as much as I did!
Caleb
Comments
Post a Comment